
Theme 1
Challenging data
There are various challenges in analysing modern data, caused by the very rich form in which it is collected. Advances in technology permit the collection of massive amounts of data in many different forms, which can arrive in high or low volumes, online or offline.
Often those data are of very high dimension, so high that traditional data processing techniques struggle to extract relevant information. Analysing those data efficiently typically requires developing new data compression tools that eliminate irrelevant noise but keep the important information. The data can even be of infinite dimension (for example in the form of curves), and the additional challenge is to find compression algorithms that exploit the continuity of the data.
Modern data are also often collected continuously as a never-ending flow of new observations whose distribution evolves with time, and it is often not possible to store more than just a small fraction of the data. Analysing such data without having to constantly access the whole flow requires the development of new methods that successively analyse observations from small time windows and aggregate the findings from those small windows in an efficient way.
An additional challenge associated with those sorts of data is that they often evolve not only over time, but also over space. They can consist of multiple observations of surfaces or higher dimensional continuous objects, which are often observed imperfectly, for example with significant gaps. Other data are challenging because they are observed with measurement errors or reported very inaccurately. If this is not accounted for, these errors and inaccuracies typically cause methods to produce biased results. Added to this is the difficulty of identifying causal effects, for example of a treatment.
The goal for ACEMS researchers working in this area is to extract the important information from data and to develop new methods of cleaning, grouping, compressing, denoising, representing, modelling and visualising the data.
People
In its final year, ACEMS members from the Challenging Data theme produced new research results, tools and collaborated on a wide range of short-term projects, including industry projects, across all nodes.
Here we review a number of vignettes from across the Centre around new research, research tools, ACEMS “Sprint” projects, and industry collaborations, and conclude with two Spotlight Studies, on the Australian Environmental Health Initiative, which collates multiple challenging health datasets, and the Virtual Antarctica study, which presents a new paradigm for Antarctic research.
A common feature of all of these projects is that they have generated new insights, collaborations, and research questions that will continue well beyond the end of ACEMS into 2022.
Research results
ACEMS PhD Student Tiffany Lo studied the local weak convergence of the linear preferential attachment random trees with additive fitness, where fitness is defined as the random initial vertex attractiveness. In particular, she showed that the local weak limit is a weighted generalisation of the Polya point tree introduced in Berger, Borgs, Chayes and Saberi (2014). Tiffany’s work also gives rates of convergence in the total variation distance for several local network statistics. Tiffany and ACEMS AI Andrew Barbour also studied the degree distribution of a randomly chosen vertex in a duplication–divergence graph, under a variety of different generalisations of the basic model of Bhan et al. (2002) and Vázquez et al. (2003). Their work pays particular attention to what happens when a non-trivial proportion of the vertices have large degrees, establishing a central limit theorem for the logarithm of the degree distribution.
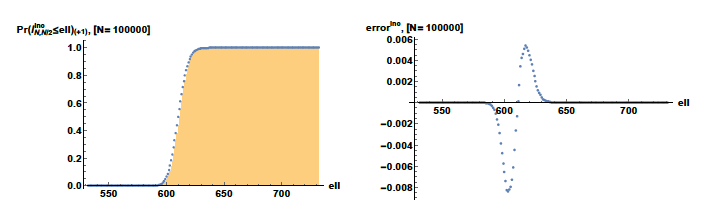
Also at the University of Melbourne, CI Peter Forrester started a project entitled "Finite size corrections for the increasing subsequence problem" in collaboration with PhD student Allan Trinh, and Research Fellow Anthony Mays. The overall theme of the project is to determine structure beyond the leading order in data sets. The data sets have in common that the leading order behaviour is, according to mathematical theorems, given by distributions from random matrix theory. They also have in common that the statistical accuracy of the data sets are such that subtracting the leading form still allows for a structured functional form to been observed. The challenge is to give a mathematical description of the functional form. In the present project this is being pursued for the increasing subsequence problem from the theory of random permutations, with Painleve transcendents used to specify theoretical subleading corrections.
AI Sophie Hautphenne, along with collaborators AI Peter Braunsteins and Carmen Minuesa (University of Extremadura, Spain, and an ACEMS visitor in 2018), developed asymptotic properties of estimators for Markov population models (more precisely, branching processes) with almost sure extinction. They introduced the concept of "Q-consistency" of an estimator, as opposed to the (classical) concept of "C-consistency". Roughly speaking, in a Markov chain {Zn} which becomes absorbed (extinct) with probability one, an estimator Tn is Q-consistent for a parameter p if, conditional on Zn>0, it converges in probability to "the quantity equivalent to p in the Q-process associated with {Zn}" as n goes to infinity, where the Q-process can be interpreted as the original process conditioned on non-extinction in the distant future. In contrast, if Tn were C-consistent, then its conditional limit would be p. They showed that the classical maximum likelihood estimators for quantities in population-size-dependent branching processes and in subcritical Galton-Watson processes are Q-consistent. The intuitive idea is that we often study endangered populations because they are still alive; for these populations, we therefore have to think about the observed population sizes as being generated under the condition Zn > 0, which biases the sample.
The researchers’ new concept of consistency leads to new research directions in statistical inference for Markov population models with almost sure extinction, on which very little work has been done before. Their research was published in the journal "Bernoulli", and Sophie is currently working on two subsequent papers in which she is developing C-consistent estimators for Markov population models with almost sure extinction.
Research tools

A team led by CI Rob Hyndman, and including ACEMS members AI Benoit Liquet, CI Kerrie Mengersen, AI Erin Peterson, AI Catherine Leigh, AI Sevvandi Kandanaarachchi, AI Pablo Montero Manso, CI Kate Smith-Miles, Student Sayani Gupta, AI Dianne Cook, RA Mitchell O'Hara-Wild, and AI Priyanga Dilini Talagala, developed a new approach to visualizing probability distributions conditional on various time granularities. This resulted in a paper in the Journal of Computational & Graphical Statistics (to appear in 2022) and the gravitas R package on CRAN. They also developed new tools for reconstructing missing and anomalous data collected from high-frequency in-situ sensors in fresh water. This led to a paper in the International Journal of Environmental Research and Public Health.
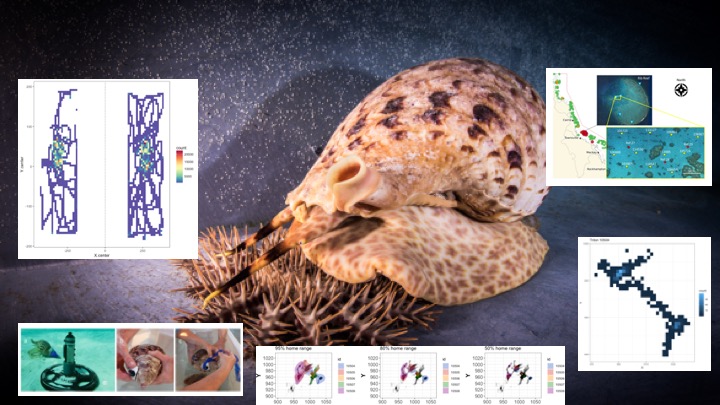
AI Patricia Menendez, along with Masters Students Varsha Ujjinni Vijay Kumar and Dilinie Seimon from Monash, and Cherie Motti from the Australian Institute of Marine Science, developed computational tools in the form of R routines compiled in an R package called Tricotracks for cleaning, correcting and preparing animal tracking records generated by the Ethovision software at scale. A cleaned data object containing the corrected tracks and additional created variables such as velocity, acceleration and movement angle is automatically prepared by one of the functions in the Tricotracks package. That function combines all the data files for a given experiment and uses information contained in the metadata of the files to create a data object that then allows the user to utilise the visualisation R routines in the same package to display the animal tracks, tracks’ distribution, spatial intensity and home range areas. In addition, a workflow analysis of the movement trajectories to study animal behaviour is proposed that allows the user to estimate periods of high and low intensity of movement, velocity or acceleration. The behaviour estimation R routines are also included in the Tricotracks package. In addition, an R vignette displaying the usage of all the functions in the package and a Shiny app that allows the user to visualise and study individual tracks was created. This project will continue in 2022, to support an existing AIMS-based project by streamlining and fast-tracking the interrogation and study of tracking data to establish whether the Triton sea snail has the potential to be a biocontrol agent against the Crown-of-Thorns Starfish on the Great Barrier Reef.
Sprint projects
A multi-node team comprising PhD Student Thomas Goodwin along with AIs Matias Quiroz and Chris Drovandi investigated frequency domain methods for stationary time series with intractable likelihoods. The project performed some simulation studies and literature review, then employed an undergraduate student to assist with obtaining and processing data. Since then, the student has completed an AMSI Vacation Research Scholar project, with work continuing on this collaboration beyond the end of ACEMS into 2022.
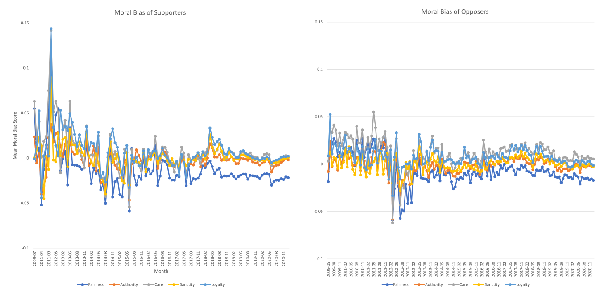
Meanwhile, AI Mehwish Nasim and CI Lewis Mitchell, with support from Luna Hoffman, examined the moral biases of Twitter users interacting online during the bushfires of 2019-20. This produced many interesting results around the differing biases and intensities of various interacting groups, and set the researchers up with a number of questions that will extend well into 2022.
Industry collaborations
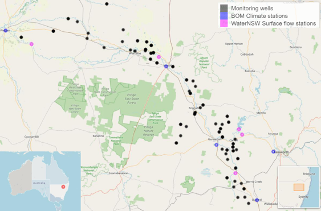
CI Louise Ryan, along with RF Stephanie Clark, AI KD Dang and CI Rob Hyndman, and Dan Pagendam (CSIRO) completed a contract with the NSW Department of Planning Industry and Environment (DPIE). In it they developed models for multi-bore analysis of data from the Namoi Richard catchment in northwest NSW. They applied cutting-edge techniques based on DeepAR, a Python-based tool for the analysis of multiple time series. The project demonstrated the potential of such methods for understanding the drivers of the system and helping to inform decisions regarding future extractions. The project was exciting from a methodological perspective since it opened up many new potential areas of further development. Louise presented the work in her lecture, given when she received the Moyal Medal in December 2021. The work has been submitted in response to an invitation to publish in a special issue entitled “Statistical Advances in Environmental Sciences” in the International Journal of Environmental Research and Public Health. Like other final-year efforts in the Challenging Data theme, it is likely that DPIE will do a follow-up project. Several DPIE researchers became excited by what they saw as the potential of the ACEMS researchers’ approach when they presented the work at one of their internal seminars in December 2021.
Spotlight On: Australian Environmental Health (AusEnHealth) Initiative
Environmental health “involves those aspects of public health concerned with the factors, circumstances, and conditions in the environment or surroundings of humans that can exert an influence on health and wellbeing”. The ongoing consideration of environmental factors is crucial for maintaining and improving the lives of humans. As a result, there is a decades-long need for access to health and environmental data across a wide range of users for the purposes of public interest, policy development, and risk and vulnerability assessment. The AusEnHealth Initiative has met this need by building a national, spatially enabled, ongoing data infrastructure resource that enables users to access, visualise, and analyse environmental health data, with key contributions from ACEMS Chief Investigator Kerrie Mengersen and ACEMS Associate Investigator Dr Aiden Price.
A significant component of this project is the identification and collation of environmental health data. One of the project activities included a data audit, designed to identify existing data custodians at both state and national levels. In the end, over 50 data custodians were established for a wide range of environmental health use cases, which were reduced to two key use cases; climate and health outcomes related to heat, and air quality and respiratory health outcomes. The main data custodians for these key use cases are given in Table 1, below.
| Data Custodian | Motivation for Use |
|---|---|
| Australian Bureau of Statistics (ABS) | High resolution point data for demographics. |
| Bureau of Meteorology (BOM) | High resolution temporally and spatially. |
| Geoscience Australia (GA) | Provides high quality, built environment data and analysis-ready satellite data through their Digital Earth Australia platform. |
| Centre for Air Pollution, Energy and Health Research (CAR) | Combines data from various air quality measuring platforms to provide modelled results that minimises the weaknesses of individual platforms. |
| Australian Urban Research Infrastructure Network (AURIN) | Provides high quality, built environment data. |
| Australian Institute of Health and Welfare (AIHW) | Provides useable data at SA3 resolution for health outcomes. |
| National Notifiable Diseases Surveillance System (NNDSS) | Provides useable data at postcode resolution for health outcomes. |
| NASA Earth Observations (NEO) | Provides medium resolution global rasters that can be used as a backup for modelling. |
| Copernicus Atmosphere Monitoring Service | Provides medium resolution global rasters for a large variety of air pollutants. |
Table 1: List of key data custodians consulted in phase 1 of the AusEnHealth Initiative.
While a small amount of this collected data is presented in the AusEnHealth pilot application in raw form, data has also been used in the creation of environmental health indicators, which “describe the link between the environment and health” as well as in the development of population vulnerability indices, which condenses all relevant data into a single relative value for each region, compared across Australia. Screenshots of the AusEnHealth pilot application are presented in Figures 1 and 2 to demonstrate how data has been presented to end users.
All of this data, including the derived indicators and indices, have been made publicly available in the pilot application. This decision has been made both in the promotion of open data practices, as well as to remain transparent about the methods used to generate any presented data. Despite a focus on a reduced selection of environmental health data, the project still resulted in the use of 55 environmental health variables, 94 derived environmental health parameters, 22 indicators, and 12 vulnerability indices.
As many of these datasets possess multiple temporal and spatial resolutions, extraordinary care was taken when deciding on visualisation principals. In the first phase of the project, very fine resolutions have come with significant performance penalties once interactive capabilities were added to the pilot application. To ensure suitable capabilities were pursued, a visualisation review was also carried out by the project team, referring to a number of existing data platforms to identify best practice. This project concludes in July 2022. However, funding opportunities are being explored to continue development on the platform and deliver a minimum viable product (MVP) for stable public use.
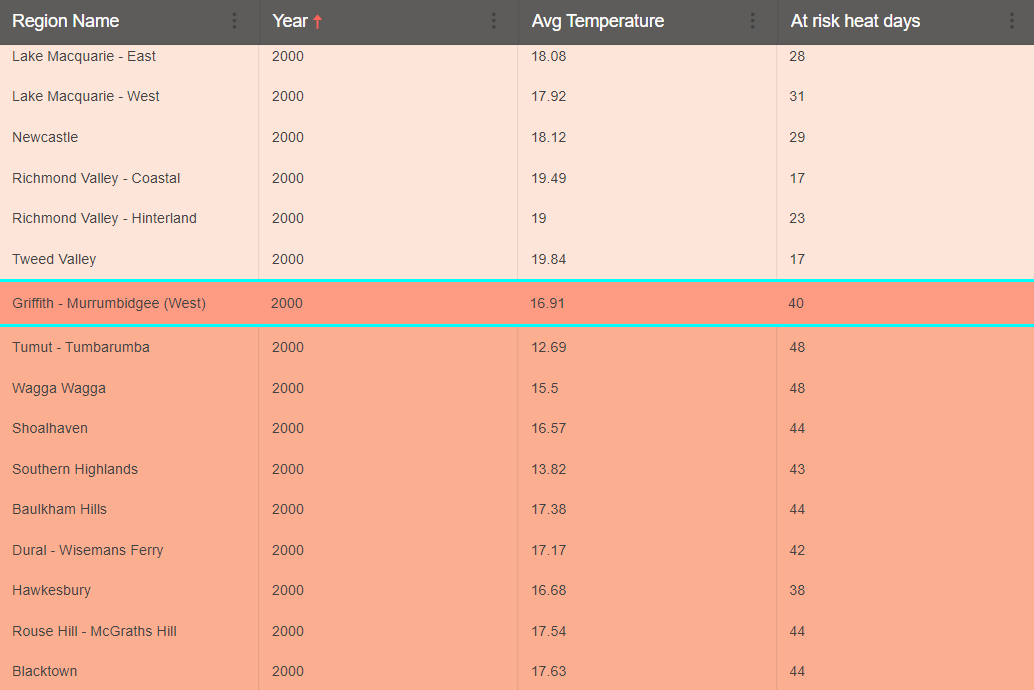
Figure 1: Example of colour-coded and highlighted data tables present in the AusEnHealth pilot application.
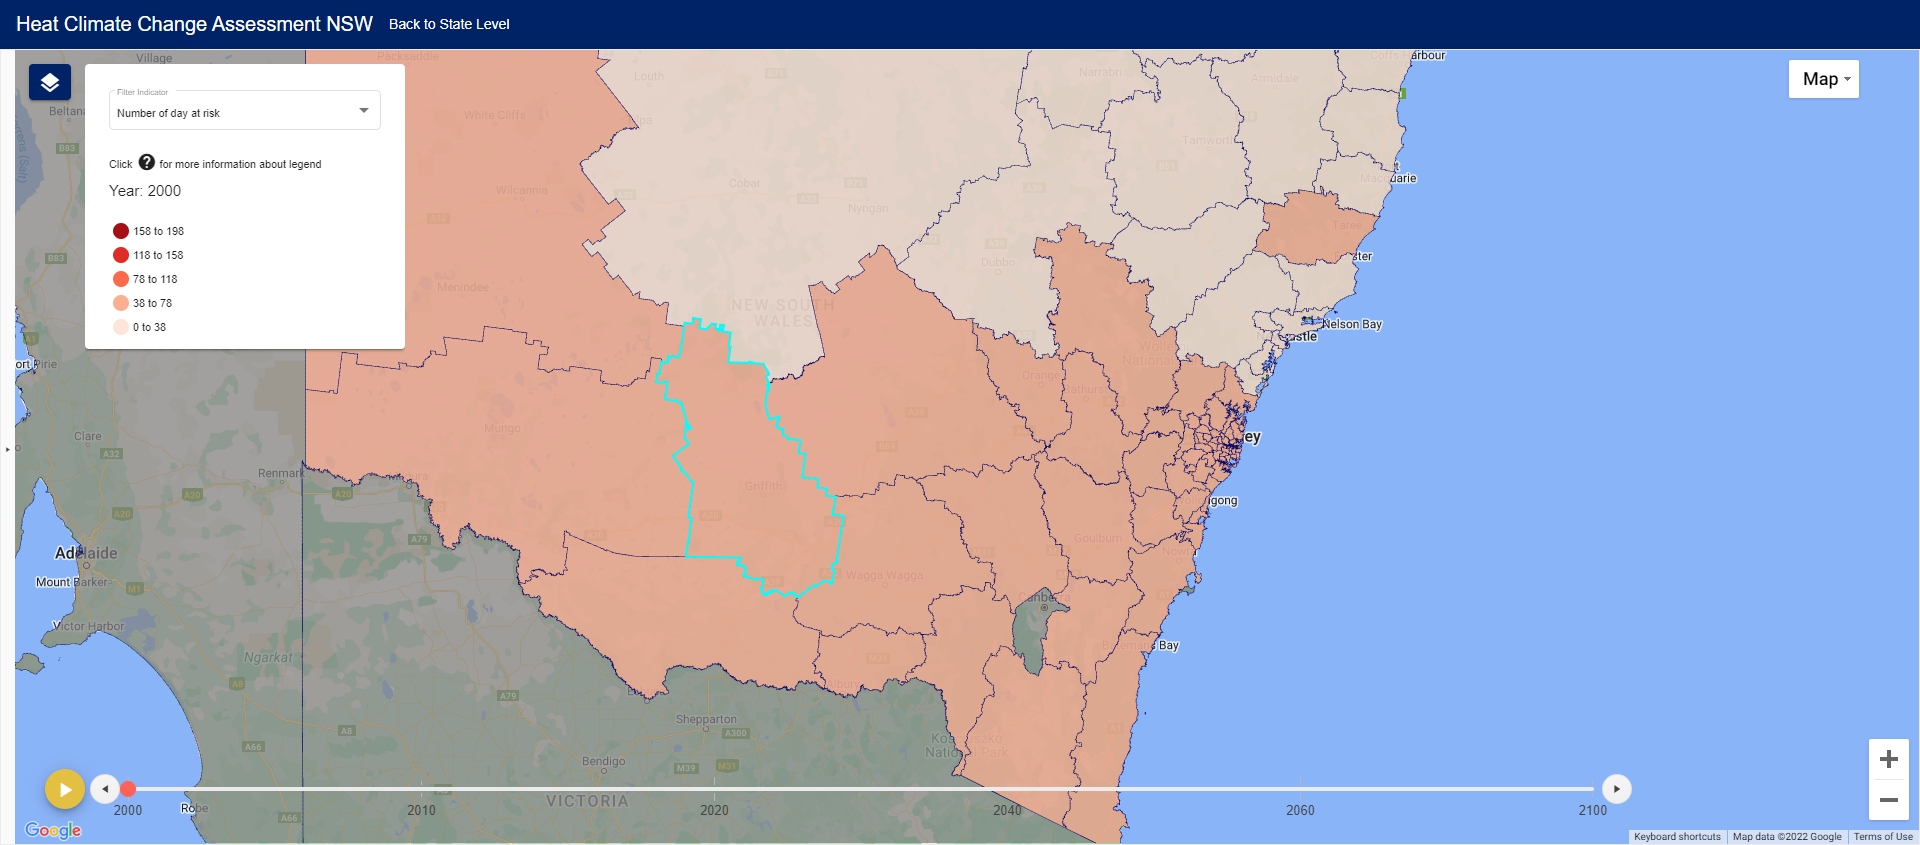
Figure 2: Example of choropleth map with interactive region highlighting, with interactive capabilities, such as shared table-map region highlighting and colour coding.
Spotlight On: Virtual Antarctica – Quantifying Aesthetic Values of the Antarctic Peninsula
In the Antarctica Peninsula, the effects of climate change and the associated increase of ice-free areas are threatening the fragile terrestrial biodiversity of these remote locations. As well as high ecological importance, these ecosystems also have unique aesthetic values which have been formally recognised in Article 3 of The Protocol on Environmental Protection to the Antarctic Treaty. The development of conservation plans should, in accordance with this protocol, also include recommendations based on aesthetic value. Currently there have been few attempts to measure aesthetics in Antarctica, and none proposing its incorporation into conservation plans because of the uncertainty associated with the quantification of aesthetic attributes.
ACEMS Chief Investigator Kerrie Mengersen and ACEMS Associate Investigators Dr Julie Vercelloni and Dr Aiden Price have helped to quantify aesthetic values in the Antarctic Peninsula by adapting novel, modern survey methods, opting for subject elicitation via an interactive virtual reality (VR) experience. These immersive surveys place subjects into a range of 360-degree scenes from the Antarctic Peninsula, using software packages to display interactive questions which elicits subjective opinion on the aesthetic values (see Figure 3, below). These questions include whether snow can be perceived, if animals can be seen, and whether there is evidence of human impact (See Table 2 for full question list). These opinions can be combined based on user certainty to produce a set of characteristics which each subject believe contribute to whether a scene is or is not aesthetic.
By providing a 360-degree VR experience instead of supplying photos, and automating the question-and-answer process instead of audio queues from an overseer, a user can become fully immersed in the provided imagery, effectively bringing the Antarctic Peninsula to the subjects to collect their opinions on aesthetic value. Following the surveys, all of the collected data was then used to parameterize a logistic regression model to explore which attributes contribute to the aesthetic value of a virtual scene in the Antarctic Peninsula.
Analysis of aesthetic value is inherently challenging due to the subjective nature of the topic. To address this issue, the original project aimed to survey individuals from three groups: civilians from Brisbane, civilians from Hobart, and conservation experts from either or both of the Australian Antarctic Division (AAD) and the Institute of Marine and Antarctic Studies (IMAS). It was hypothesised that there would be negligible differences between responses from the different groups, thus strengthening the overall results. Unfortunately, however, performing VR surveys was determined to be high risk with respect to the spread of COVID-19, which led to a delay in the survey activities and ultimately a reduced scope to include only Brisbane civilians.
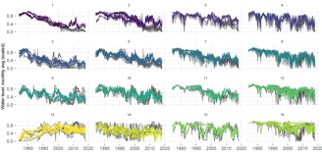
During the project, a total of 43 participants were each shown a selection of seven images, and gave responses to eight questions per image, each being displayed in sequence. Over 30 Bayesian models were created using the data, with some variations including different categorical variable baselines, increased prior variance, and longer Markov Chain Monte Carlo (MCMC) chains for determining posterior distributions. From these variations, a model was chosen through the comparison of deviance information criteria (DIC) calculations (see Figure 4 for each characteristic’s posterior statistics).
This project concluded in December 2021, with resulting data, models, and visualisations being constructed into a research paper for publication. Given the promising results of this project, the project personnel are looking to extend this work to carry out an increased number of surveys on both the public and conservation experts with an improved set of images to further gauge the impact of various characteristics on aesthetic value of scenes from the Antarctic Peninsula.
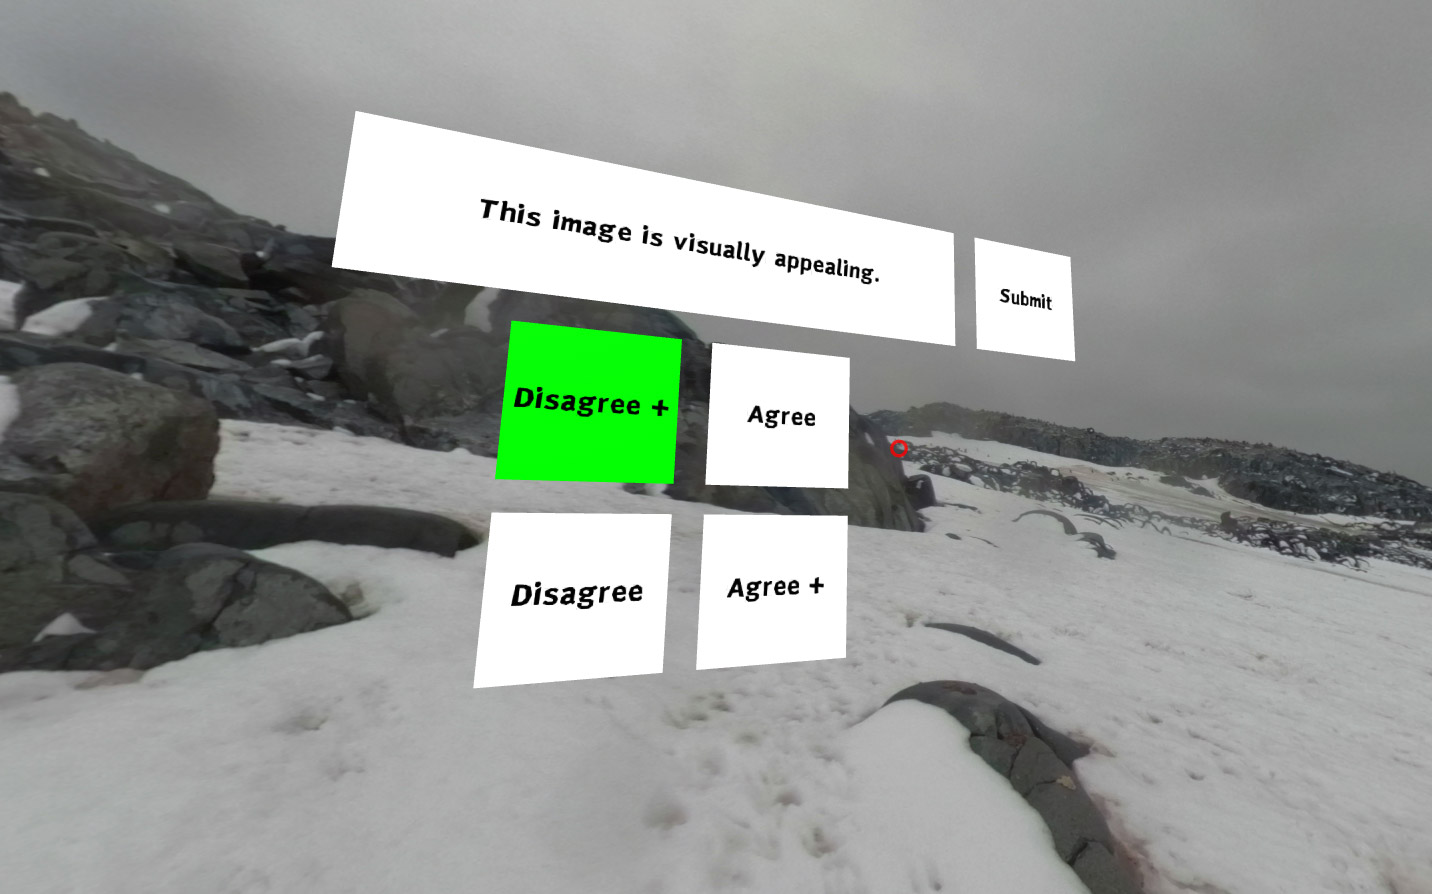
Figure 3: Example of 360-degree scene with a displayed question, viewed through a web browser.
| Question Number | Abbreviation | Question Interview Text |
|---|---|---|
| 1 | Beauty | This image is visually appealing. |
| 2 | Human impact presence | There is evidence of human impact. |
| 3 | Iconic species presence | There are penguins or seals in the image. |
| 4 | Biodiversity presence | There are other animals or plants in the image. |
| 5 | Snow presence | The landscape is covered in snow. |
| 6 | Colour image | The colours in the image are monotonous. |
| 7 | Human presence | There are many people in the image. |
| 8 | Good weather | The weather is nice. |
Table 2: Characteristics used to determine contribution to aesthetic value.
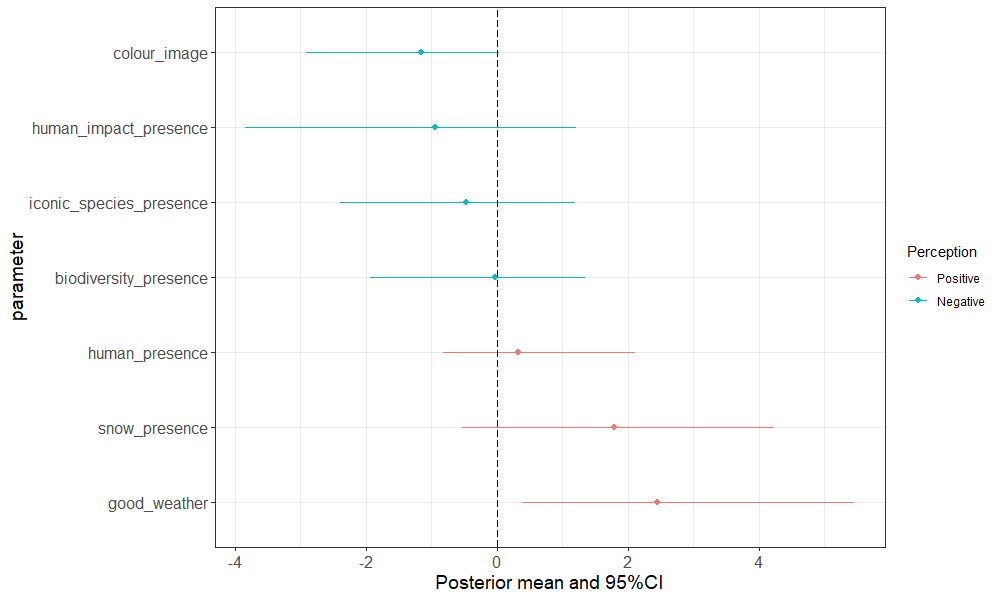
Figure 4: Posterior mean and 95% confidence interval for each of the aesthetic characteristics used in the highest performing statistical model.