
Research software and services
In 2021, ACEMS members were active in:
- Producing, publishing, and updating research/open-source software, particularly R Packages hosted on platforms including CRAN, Github and MapleCloud.
- Supporting the Australian Research Data Commons (ARDC) in its strategic agenda for research software.
- Helping to educate and enable end-users about research/open-source software, including through podcasts, lectures, guest presentations, briefings, and blog articles.
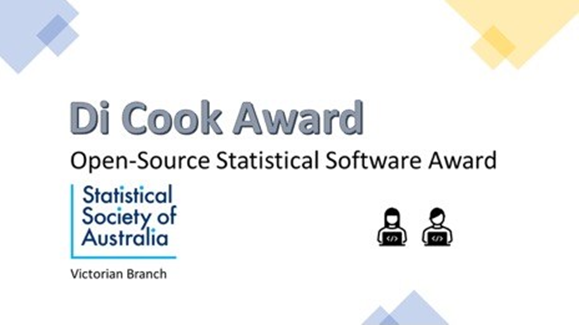
- Recognising excellence in research software development with the introduction of the Di Cook award.
Further, significant outcomes and benefits have been realised from ACEMS software outputs, including for Partner Organisations like CSIRO via their RiskLab and AIMS, as well as other end-users in the research community and industry such as the Federal Reserve.
New and Updated Open-Source Software Packages
ACEMS members published and made significant updates to software packages published for open access on a range of platforms, including CRAN, GitHub and MapleCloud. Some further details including download metrics are given in Table 1 below. Note that this list is not exhaustive with respect to either R or other open-source packages created by ACEMS members. For example, R code and packages are often outputs of collaborative research projects, such as this free software program "Predicting seagrass decline due to cumulative stressors", and may be shared in other repositories such as GitHub.
| Table 1: Software Packages Created/Updated in 2021 | |||
|---|---|---|---|
| Package | Maintainer | Description | 2021 Downloads; 2021 Monthly Average* |
| forecast | Rob Hyndman | Methods and tools for displaying and analysing univariate time series forecasts including exponential smoothing via state space models and automatic ARIMA modelling. | 3368082; 280674 |
| DescTools | Andri Signorell | A collection of miscellaneous basic statistic functions and convenience wrappers for efficiently describing data. The author's intention was to create a toolbox, which facilitates the (notoriously time consuming) first descriptive tasks in data analysis, consisting of calculating descriptive statistics, drawing graphical summaries and reporting the results. The package contains furthermore functions to produce documents using MS Word (or PowerPoint) and functions to import data from Excel. Many of the included functions can be found scattered in other packages and other sources written partly by Titans of R. The reason for collecting them here, was primarily to have them consolidated in ONE instead of dozens of packages (which themselves might depend on other packages which are not needed at all), and to provide a common and consistent interface as far as function and arguments naming, NA handling, recycling rules etc. are concerned. Google style guides were used as naming rules (in absence of convincing alternatives). The 'BigCamelCase' style was consequently applied to functions borrowed from contributed R packages as well. | 694032; 57836 |
| hdrcde | Rob Hyndman | Computation of highest density regions in one and two dimensions, kernel estimation of univariate density functions conditional on one covariate, and multimodal regression. | 216906; 18076 |
| hts | Earo Wang | Provides methods for analysing and forecasting hierarchical and grouped time series. The available forecast methods include bottom-up, top-down, optimal combination reconciliation (Hyndman et al. 2011) <doi:10.1016/j.csda.2011.03.006>, and trace minimization reconciliation Wickramasuriya et al. 2018) <doi:10.1080/01621459.2018.1448825>. | 215430; 17952 |
| tsibble | Earo Wang | Provides a 'tbl_ts' class (the 'tsibble') for temporal data in an data- and model-oriented format. The 'tsibble' provides tools to easily manipulate and analyse temporal data, such as filling in time gaps and aggregating over calendar periods. | 204754; 17063 |
| fabletools | Mitchell O’Hara-Wild | Provides tools, helpers and data structures for developing models and time series functions for 'fable' and extension packages. These tools support a consistent and tidy interface for time series modelling and analysis. | 124361; 10363 |
| feasts | Mitchell O’Hara-Wild | Provides a collection of features, decomposition methods, statistical summaries and graphics functions for the analysing tidy time series data. The package name 'feasts' is an acronym comprising of its key features: Feature Extraction And Statistics for Time Series. | 111506; 9292 |
| fable | Mitchell O’Hara-Wild | Provides a collection of commonly used univariate and multivariate time series forecasting models including automatically selected exponential smoothing (ETS) and autoregressive integrated moving average (ARIMA) models. These models work within the 'fable' framework provided by the 'fabletools' package, which provides the tools to evaluate, visualise, and combine models in a workflow consistent with the tidyverse. | 107671; 8973 |
| fpp3 | Rob Hyndman | All data sets required for the examples and exercises in the book "Forecasting: principles and practice" by Rob J Hyndman and George Athanasopoulos <https://OTexts.com/fpp3/>. All packages required to run the examples are also loaded. | 60888; 5074 |
| tsibbledata | Mitchell O’Hara-Wild | Provides diverse datasets in the 'tsibble' data structure. These datasets are useful for learning and demonstrating how tidy temporal data can tidied, visualised, and forecasted. | 56156; 4680 |
| vitae | Mitchell O’Hara-Wild | Provides templates and functions to simplify the production and maintenance of curriculum vitae. | 20847; 1737 |
| bfast | Dainius Masiliunas | Decomposition of time series into trend, seasonal, and remainder components with methods for detecting and characterizing abrupt changes within the trend and seasonal components. 'BFAST' can be used to analyze different types of satellite image time series and can be applied to other disciplines dealing with seasonal or non-seasonal time series, such as hydrology, climatology, and econometrics. The algorithm can be extended to label detected changes with information on the parameters of the fitted piecewise linear models. 'BFAST' monitoring functionality is described in Verbesselt et al. (2010) <doi:10.1016/j.rse.2009.08.014>. 'BFAST monitor' provides functionality to detect disturbance in near real-time based on 'BFAST'- type models, and is described in Verbesselt et al. (2012) <doi:10.1016/j.rse.2012.02.022>. 'BFAST Lite' approach is a flexible approach that handles missing data without interpolation, and will be described in an upcoming paper. Furthermore, different models can now be used to fit the time series data and detect structural changes (breaks). | 19278; 1606 |
| eechidna | Jeremy Forbes | Data from the seven Australian Federal Elections (House of Representatives) between 2001 and 2019, and from the four Australian Censuses over the same period. Includes tools for visualizing and analysing the data, as well as imputing Census data for years in which a Census does not occur. This package incorporates data that is copyright Commonwealth of Australia (Australian Electoral Commission and Australian Bureau of Statistics) 2019. | 6901; 575 |
| bayesforecast | Asael Alonzo Matamoros | Fit Bayesian time series models using 'Stan' for full Bayesian inference. A wide range of distributions and models are supported, allowing users to fit Seasonal ARIMA, ARIMAX, Dynamic Harmonic Regression, GARCH, t-student innovation GARCH models, asymmetric GARCH, Random Walks, stochastic volatility models for univariate time series. Prior specifications are flexible and explicitly encourage users to apply prior distributions that actually reflect their beliefs. Model fit can easily be assessed and compared with typical visualization methods, information criteria such as loglik, AIC, BIC WAIC, Bayes factor and leave-one-out cross-validation methods. References: Hyndman (2017) <doi:10.18637/jss.v027.i03>; Carpenter et al. (2017) <doi:10.18637/jss.v076.i01>. | 6868; 572 |
| seer | Thiyanga Talagala | A novel meta-learning framework for forecast model selection using time series features. Many applications require a large number of time series to be forecast. Providing better forecasts for these time series is important in decision and policy making. We propose a classification framework which selects forecast models based on features calculated from the time series. We call this framework FFORMS (Feature-based FORecast Model Selection). FFORMS builds a mapping that relates the features of time series to the best forecast model using a random forest. 'seer' package is the implementation of the FFORMS algorithm. For more details see our paper at <https://www.monash.edu/business/econometrics-and-business-statistics/research/publications/ebs/wp06-2018.pdf>. | 6734; 561 |
| nortsTest | Asael Alonzo Matamoros | Despite that several tests for normality in stationary processes have been proposed in the literature, consistent implementations of these tests in programming languages are limited. Four normality test are implemented. The Lobato and Velasco's, Epps, Psaradakis and Vavra, and the random projections tests for stationary process. Some other diagnostics such as, unit root test for stationarity, seasonal tests for seasonality, and arch effect test for volatility; are also performed. The package also offers residual diagnostic for linear time series models developed in several packages. | 6357; 530 |
| HRW | Matt Wand | The book "Semiparametric Regression with R" by J. Harezlak, D. Ruppert & M.P. Wand (2018, Springer; ISBN: 978-1-4939-8851-8) makes use of datasets and scripts to explain semiparametric regression concepts. Each of the book's scripts are contained in this package as well as datasets that are not within other R packages. Functions that aid semiparametric regression analysis are also included. | 6339; 528 |
| lookout | Sevvandi Kandanaarachchi | Outlier detection using leave-one-out kernel density estimates and extreme value theory. The bandwidth for kernel density estimates is computed using persistent homology, a technique in topological data analysis. Using peak-over-threshold method, a generalized Pareto distribution is fitted to the log of leave-one-out kde values to identify outliers. | 3996; 333 |
| spotoroo | Weihao Li | An algorithm to cluster satellite hot spot data spatially and temporally. | 3527; 294 |
| Rsfar | Hossein Haghbin | This is a collection of functions designed for simulating, estimating and forecasting seasonal functional autoregressive time series of order one. These methods are addressed in the manuscript: <https://www.monash.edu/business/ebs/research/publications/ebs/wp16-2019.pdf>. | 3522; 294 |
| ferrn | Huize Sherry Zhang | Diagnostic plots for optimisation, with a focus on projection pursuit. These show paths the optimiser takes in the high-dimensional space in multiple ways: by reducing the dimension using principal component analysis, and also using the tour to show the path on the high-dimensional space. Several botanical colour palettes are included, reflecting the name of the package. | 3509; 292 |
| nestr | Emi Tanaka | Facilitates building a nesting or hierarchical structure as a list or data frame by using a human friendly syntax. | 3385; 282 |
| flipbookr | Evangeline Reynolds | Flipbooks present code step-by-step and side-by-side with its output. 'flipbookr' helps creators build flipbooks efficiently because code pipelines are automatically parsed and prepped for presentation as flipbooks. | 3339; 278 |
| liminal | Stuart Lee | Compose interactive visualisations designed for exploratory high-dimensional data analysis. With 'liminal' you can create linked interactive graphics to diagnose the quality of a dimension reduction technique and explore the global structure of a dataset with a tour. A complete description of the method is discussed in ['Lee' & 'Laa' & 'Cook' (2020) <arXiv:2012.06077>]. | 2863; 239 |
| outlierensembles | Sevvandi Kandanaarachchi | Ensemble functions for outlier/anomaly detection. There is a new ensemble method proposed using Item Response Theory. Existing outlier ensemble methods from Schubert et al (2012) <doi:10.1137/1.9781611972825.90>, Chiang et al (2017) <doi:10.1016/j.jal.2016.12.002> and Aggarwal and Sathe (2015) <doi:10.1145/2830544.2830549> are also included. | 2691; 224 |
| cropgrowdays | Peter Baker | Calculate agrometeorological variables for crops including growing degree days (McMaster, GS & Wilhelm, WW (1997) <doi:10.1016/S0168-1923(97)00027-0>), cumulative rainfall, number of stress days and cumulative or mean radiation and evaporation. Convert dates to day of year and vice versa. Also, download curated and interpolated Australian weather data from the Queensland Government DES longpaddock website <https://www.longpaddock.qld.gov.au/>. This data is freely available under the Creative Commons 4.0 licence. | 2656; 221 |
| learningtower | Kevin Wang | The Programme for International Student Assessment (PISA) is a global study conducted by the Organization for Economic Cooperation and Development (OECD) in member and non-member countries to assess educational systems by assessing 15-year-old school students academic performance in mathematics, science, and reading. This datasets contains information on their scores and other socioeconomic characteristics, information about their school and its infrastructure, as well as the countries that are taking part in the program. | 1801; 150 |
| adbb | Rob Hyndman | An R package containing state-level demographic data for Australia. To be used in conjunction with the demography package. | - |
| ccpdmp | Matt Sutton | PDMP-based samplers move a particle with a state and velocity using deterministic dynamics. At random event times the velocity is updated and the particle continues. The trajectories returned by the sampler define a Markov process sampling the distribution of interest. For more information see Joris Bierken’s Overview, the great Julia package ZigZagBoomerang and our Arxiv preprint: https://arxiv.org/abs/2112.12897. This package implements the concave-convex PDMP algorithm to facilitate sampling from distributions of interest (particularly Bayesian distributions). | - |
| conmat | Nicholas Tierney | The goal of conmat is to provide methods for producing contact matrices. | - |
| cricketdata | Rob Hyndman | Functions for downloading data on international and other major cricket matches from ESPNCricinfo and Cricsheet. This package provides some functions to download the data into tibbles ready for analysis. | - |
| fasster | Mitchell O'Hara-Wild | An implementation of the FASSTER (Forecasting with Additive Switching of Seasonality, Trend and Exogenous Regressors) model in R. This model is designed to capture patterns of multiple seasonality in a state space framework by using state switching. The fasster package prioritizes flexibility, computational speed and accuracy to provide convenient tools for modelling, predicting and understanding high frequency time-series. | - |
| Identification-two-phase-recovery | David Warne | This repository contains useful R functions and scripts to process coral cover data obtained from reef surveys to classify patterns in recovery trajectories following major disturbance events. | - |
| Maple 2020 procedures and a dashboard for interactive testing of uncontrolled linear-time-invariant structures for structural global identifiability | Jason Whyte | This worksheet relates to the testing of a particular type of "model structure" (collection of related models) for the property of structural global identifiability (SGI). The absence of this property makes it very unlikely that we can obtain a unique estimate of the structure's parameters when calibrating the structure to data. This may mean that we cannot use our structure to make predictions, and the time, effort, and resources used in modelling and data collection may be unproductive. However, we may be able to anticipate this problem in advance of data collection. The content below relates to my book chapter "Branching out into Structural Identifiability Analysis with Maple: Interactive Exploration of Uncontrolled Linear Time-Invariant Structures", to appear in "Maple in Mathematics Education and Research" (the Proceedings of the Maple 2020 Conference, Editors Rob Corless, Jürgen Gerhard, and Ilias Kotsireas), a book in Springer's series "Communications in Computer and Information Science". (The pre-print is available here https://arxiv.org/abs/2103.11309) | - |
| ozbabynames | Rob Hyndman | The ozbabynames package provides the dataset ozbabynames. This contains popular Australian baby names by sex, state and year. | - |
| PETabc | Clara Grazian | This package performs simulation and Bayesian analysis of kinetic models, in particular of single-tissue and two-tissue compartment models. The Bayesian analysis is performed through rejection ABC, with summary statistics obtained through smooth splines. | - |
| tidytreatment | Joshua Bon | Functions for extracting tidy data from Bayesian treatment effect models, in particular BART, but extensions are possible. Functionality includes extracting tidy posterior summaries as in 'tidybayes' <https://github.com/mjskay/tidybayes>, estimating (average) treatment effects, common support calculations, and plotting useful summaries of these. | - |
| yahtsee | Nicholas Tierney | The goal of yahtsee is to provide tools around fitting hierarchical time series models for data commonly found in malaria. | - |
Current ACEMS Packages Maintained
ACEMS members maintain a wide variety of R Packages which remain popular amongst CRAN’s diversity of international users. Since 2016 ACEMS has published and maintained over 100 open-source packages on the CRAN platform. These open-source software packages on CRAN have been downloaded more than 73.6 million times since 2016 by students, researchers, and other end-users. A selection of some of the most downloaded packages are shown in Table 2 below.
| Table 2: Popular ACEMS Software Packages Published to CRAN (>200,000 downloads) | |||
|---|---|---|---|
| Package | Maintainer | Current Version | Downloads (since 2016) |
| rmarkdown | Yihui Xie | 2.11 | 32717202 |
| forecast | Rob Hyndman | 8.15 | 11662976 |
| fracdiff | Martin Maechler | 1.5-1 | 7846588 |
| GGally | Barret Schloerke | 2.1.2 | 3545227 |
| KernSmooth | Brian Ripley | 2.23-20 | 2158380 |
| DescTools | Andri Signorell | 0.99.44 | 2136250 |
| expsmooth | Rob Hyndman | 2.3 | 1523874 |
| fma | Rob Hyndman | 2.4 | 1063133 |
| imputeTS | Steffen Moritz | 3.2 | 971113 |
| fpp | Rob Hyndman | 0.5 | 782840 |
| naniar | Nicholas Tierney | 0.6.1 | 744289 |
| visdat | Nicholas Tierney | 0.5.3 | 713627 |
| rticles | Christophe Dervieux | 0.22 | 553193 |
| hts | Earo Wang | 6.0.2 | 526154 |
| tsibble | Earo Wang | 1.1.1 | 506591 |
| fpp2 | Rob Hyndman | 2.4 | 488353 |
| distributional | Mitchell O'Hara-Wild | 0.2.2 | 423910 |
| hdrcde | Rob Hyndman | 3.4 | 383319 |
| rainbow | Han Lin Shang | 3.6 | 340607 |
| tsfeatures | Rob Hyndman | 1.0.2 | 328420 |
| thief | Rob Hyndman | 0.3 | 313749 |
| fds | Han Lin Shang | 1.8 | 287994 |
| fabletools | Mitchell O'Hara-Wild | 0.3.2 | 282413 |
| fable | Mitchell O'Hara-Wild | 0.3.1 | 239963 |
| feasts | Mitchell O'Hara-Wild | 0.2.2 | 231037 |
| xaringan | Yihui Xie | 0.22 | 208020 |
Supporting ARDC Strategy for Recognising Software as a First-Class Research Output
The Australian Research Data Commons (ARDC) is developing a national research software agenda to establish research software as a first class research output.
Developing and implementing a national research software agenda is a strategic activity for the ARDC’s Platforms and Software theme. Over 2020-2023, this initiative will enable the ARDC to establish the agenda for recognition of research software as a first-class research output, alongside journal papers and datasets, and for recognising the importance of software as a research enabler.”
ACEMS and its members engaged with the ARDC and collaborated in co-hosting several events to promote and advocate software as a first-class research output. This suite of events held in the latter part of 2021 included:
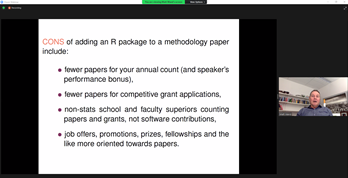
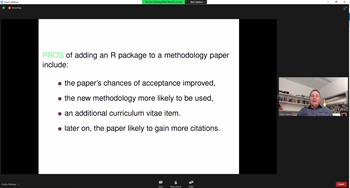
- An ACEMS public lecture by ACEMS CI Matt Wand titled “Statistical Methodology Development and Software Dissemination” with multiple members from the ARDC present.
-
A Random Sample podcast episode titled “Software as a first-class research output”. In this episode ACEMS CI Rob Hyndman describes a recent policy change at the Monash Business School to recognise software outputs in that faculty for the purposes of career progression. The discussion also featured Tom Honeyman from the ARDC and was hosted by ACEMS AI Nick Tierney.

- ACEMS hosted an expert panel webinar titled “Open-source research software panel discussion”. The panel was hosted by ACEMS PhD Student Katie Buchhorn and featured Tom Honeyman from the ARDC and ACEMS AIs Di Cook, Sevvandi Kandanaarachchi and Dan Simpson. The panel discussed how open-source software development benefits researchers and others, effect on career development, research impact via software, what can be done to increase uptake and usability, and getting recognition for publishing research software.
Educating and enabling end-users about open-source research software
ACEMS members were also featured in or organised multiple public lectures, podcasts, invited seminars and presentations, and workshops for open-source software end-users, related to research software packages. A selection of these events and presentations from 2021 are in Table 3 below.
| Table 3: Selected presentations relating to open-source research software in 2021 | |||
|---|---|---|---|
| Forum | Presentation | Speaker(s) | |
| ACEMS/Australian Data Science Network - Focused Workshop: Synthetic Data | GRATIS: GeneRAting TIme Series with diverse and controllable characteristics | Rob Hyndman | |
| ACEMS Podcast – The Random Sample | Episode 66: Software as a First-Class Research Output | Tom Honeyman (ARDC), Rob Hyndman, and Nick Tierney | |
| ACEMS Public Lecture | Statistical Methodology Development and Software Dissemination | Matt Wand | |
| ACEMS Public Lecture | Uncertain futures: what can we forecast and when should we give up? | Rob Hyndman | |
| ACEMS Technical Talk | Greta: Simple and Scalable Statistical Modelling in R | Nick Tierney | |
| E.A. Cornish Lecture | Feasts and fables: modern tools for time series analysis | Rob Hyndman | |
| IASSL Workshop | Data Analysis with R Programming for Beginners | Priyanga Dilini Talagala and Thiyanga Talagala | |
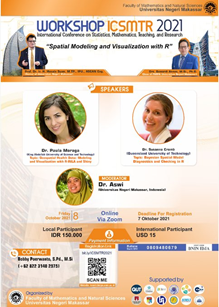
| ICSMTR 2021 | Spatial Modelling and Visualization with R | Susanna Cramb | |
| Malaysia R 2021 | The Role of R and Data Visualisation in Understanding Your World | Di Cook | |
| Monash MDFI Meetup | The right to access, open data, open software, diagnostics and statistics as integral components of AI | Di Cook | |
| QUT Centre for Data Science Seminar | Use of Open-Source Tools* for the Australian Environmental Health Atlas (AusEnHealth) [*including visualisation of aggregated spatial data using R, leaflet, and RShiny] | Aiden Price | |
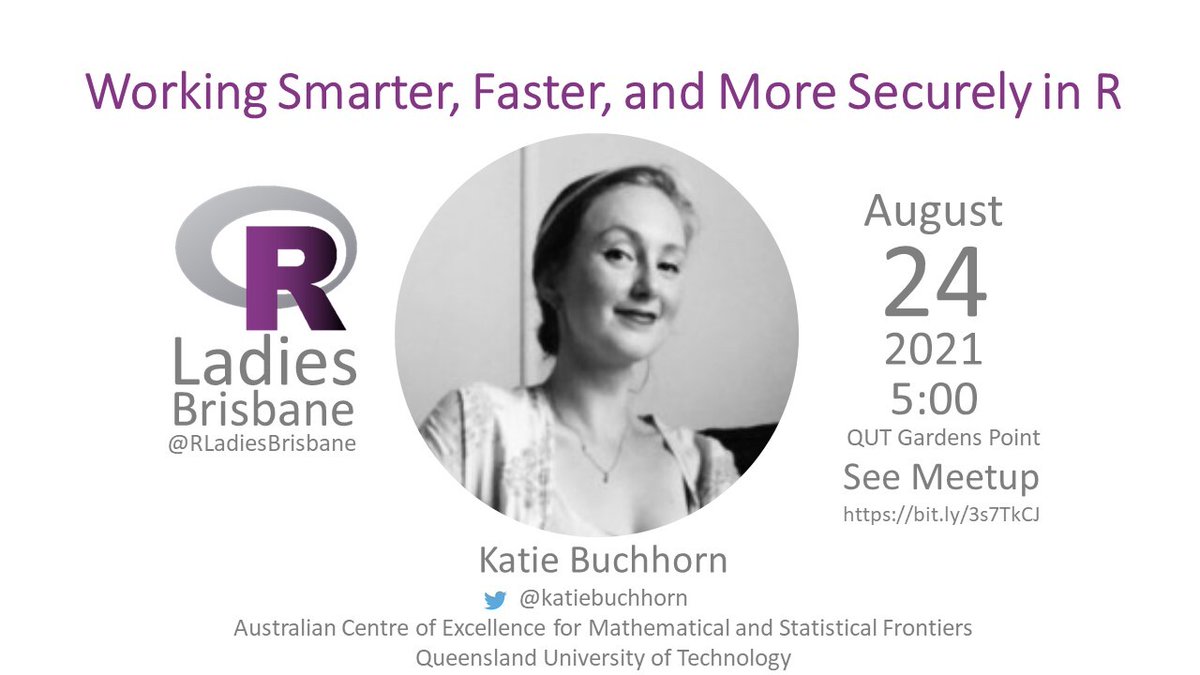
| R Ladies Workshop | Working smarter, faster and more securely in R | Katie Buchhorn | |
| RStudio Blog + RStudio YouTube Channel | An inclusive solution for teaching and learning R during the COVID pandemic | Patricia Menendez | |
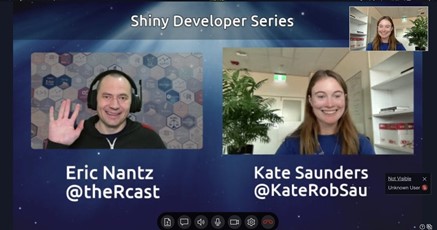
| Shiny Dev Podcast @theRcast | Episode 28: The transformative effects of Shiny with the coronaSweeper app | Kate Saunders | |
| Statistical Society of Australia Workshop | An introduction to Bayesian modelling using greta | Nick Golding (Telethon Kids) and Nick Tierney | |
| Statistical Society of Australia Workshop | Data Visualisation with R | Di Cook and Emi Tanaka | |
| United Nations Training Program on Earth Observations for Agricultural Statistics | Virtual Presentation to UN Global Working Group on Big Data, US - Training in the Use of Big Data and Data Science | Amy Stringer | |
| Why R? 2021 Conference | Feasts & fables: modern tools for time series analysis | Rob Hyndman | |
In addition to these events, many ACEMS members support the development, profile, and adoption of research software by publishing articles on online blogs, informal mentoring sessions and briefings with industry stakeholders. Some examples include:
- ACEMS CI Rob Hyndman briefed Australia’s Federal Reserve Board’s UseR group on time series analysis using the tssible, feasts, and fable packages – some of the most frequently downloaded ACEMS R packages on CRAN.
- ACEMS AI Patricia Menendez authored a blog post for RStudio, RStudio Cloud: An inclusive solution for learning R, and then presented in a related RStudio YouTube event.
- ACEMS AI Nick Tierney (a member of the R Journal Editorial Board) co-hosts a social co-working and office hours event with the international group, rOpenSci. The event is held bi-monthly online with developers from around the world to exchange advice, ideas and improvements for existing R packages.
Recognising excellence in research software development
ACEMS AI Di Cook, who is most well-known for her research in visual inference and high-dimensional data visualisation and as an avid advocate of statistical software development, has funded the Di Cook Award for “Open-Source Statistical Software Award”.
This award was promoted in 2021 in collaboration with the Statistical Society of Australia’s Victorian Branch to acknowledge excellent open-source statistical software developed by students and recent graduates of Victorian and Tasmanian research institutes.
The award was first announced publicly on 22nd September 2021 at the SSA Vic event on that day. The award will be given out yearly. For more information about the award, please see: https://statsocaus.github.io/dicook-award/.
Outcomes and Impacts from End-User Use of Software
Downloads of open-source software developed and published by ACEMS members to date are counted in the tens of millions.
In addition to these significant outcomes, important benefits are being realised from the use of such software – including by end users in research, government, industry, and hackathons.
For example, the software package R2VR developed by ACEMS and CSIRO collaborators, has been used to provide immersive experiences in environments and to support research quantifying the aesthetics of key ecosystems including the Great Barrier Reef to inform reporting to UNESCO reporting purposes and, most recently, for Antarctica as part of the Virtual Antarctica project – a collaboration involving ACEMS PhD student Katie Buchhorn, and ACEMS AIs Julie Vercelloni and Aiden Price.
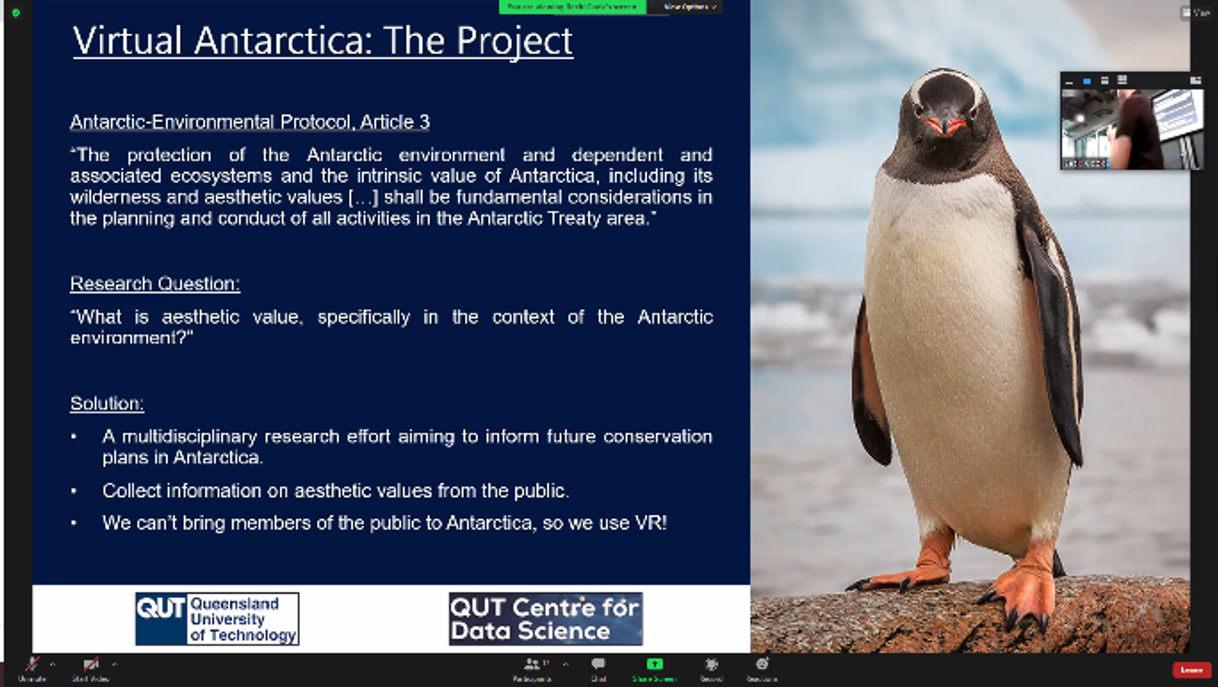
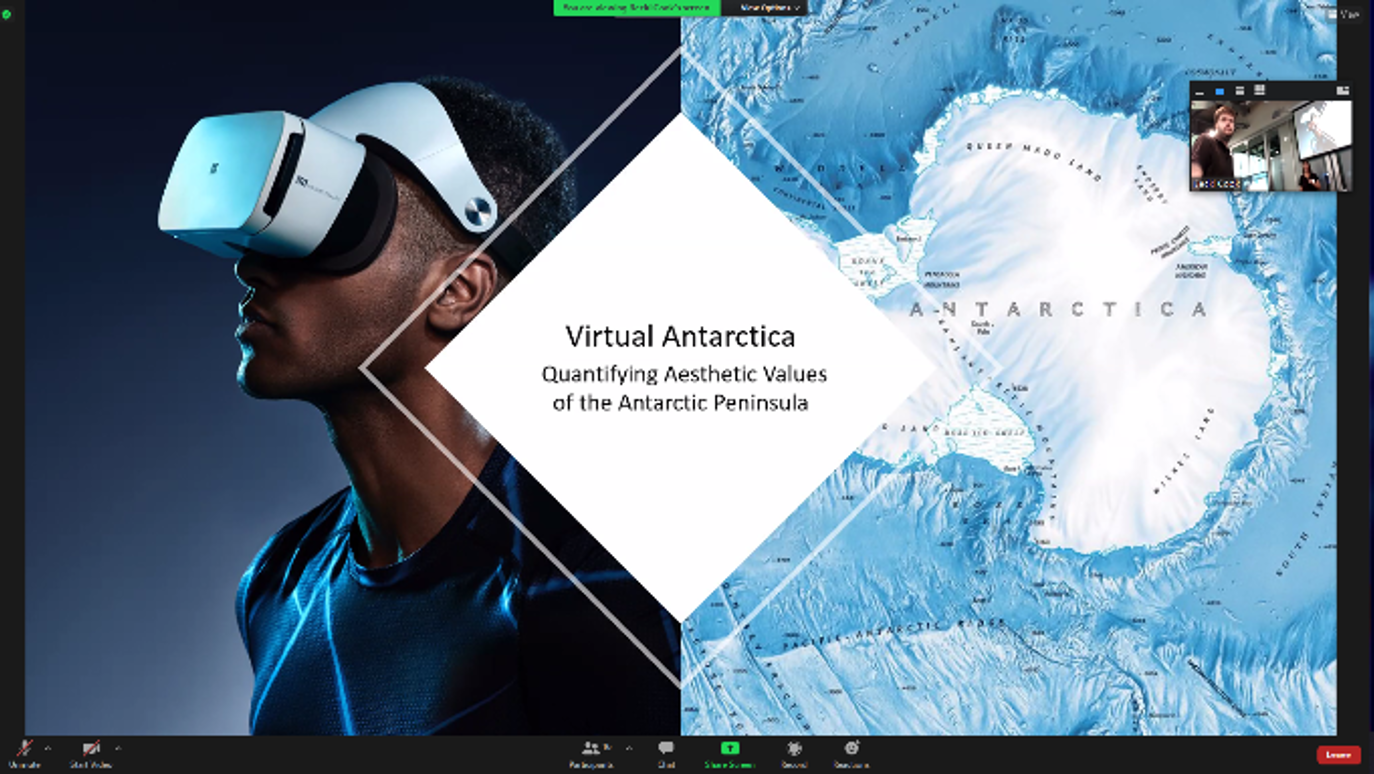
Slides from a presentation by ACEMS PhD student Katie Buchhorn on the Virtual Antarctica project.